The View Debugger in Xcode
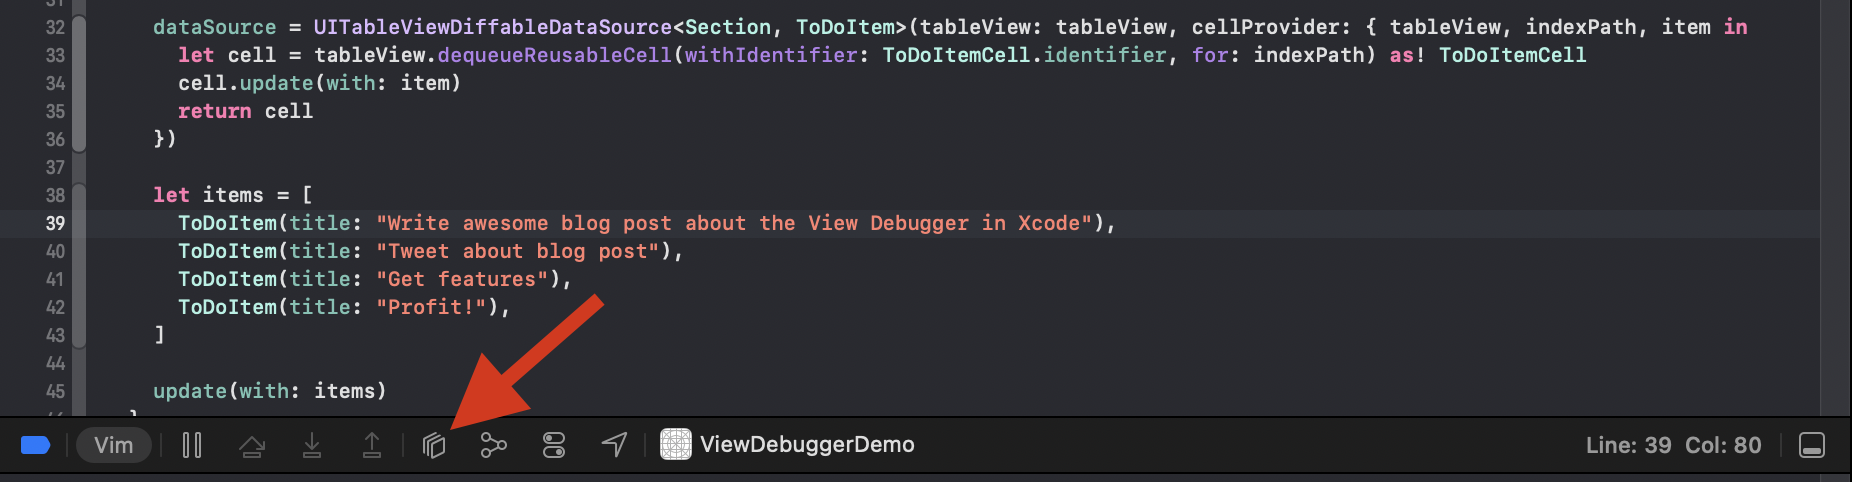
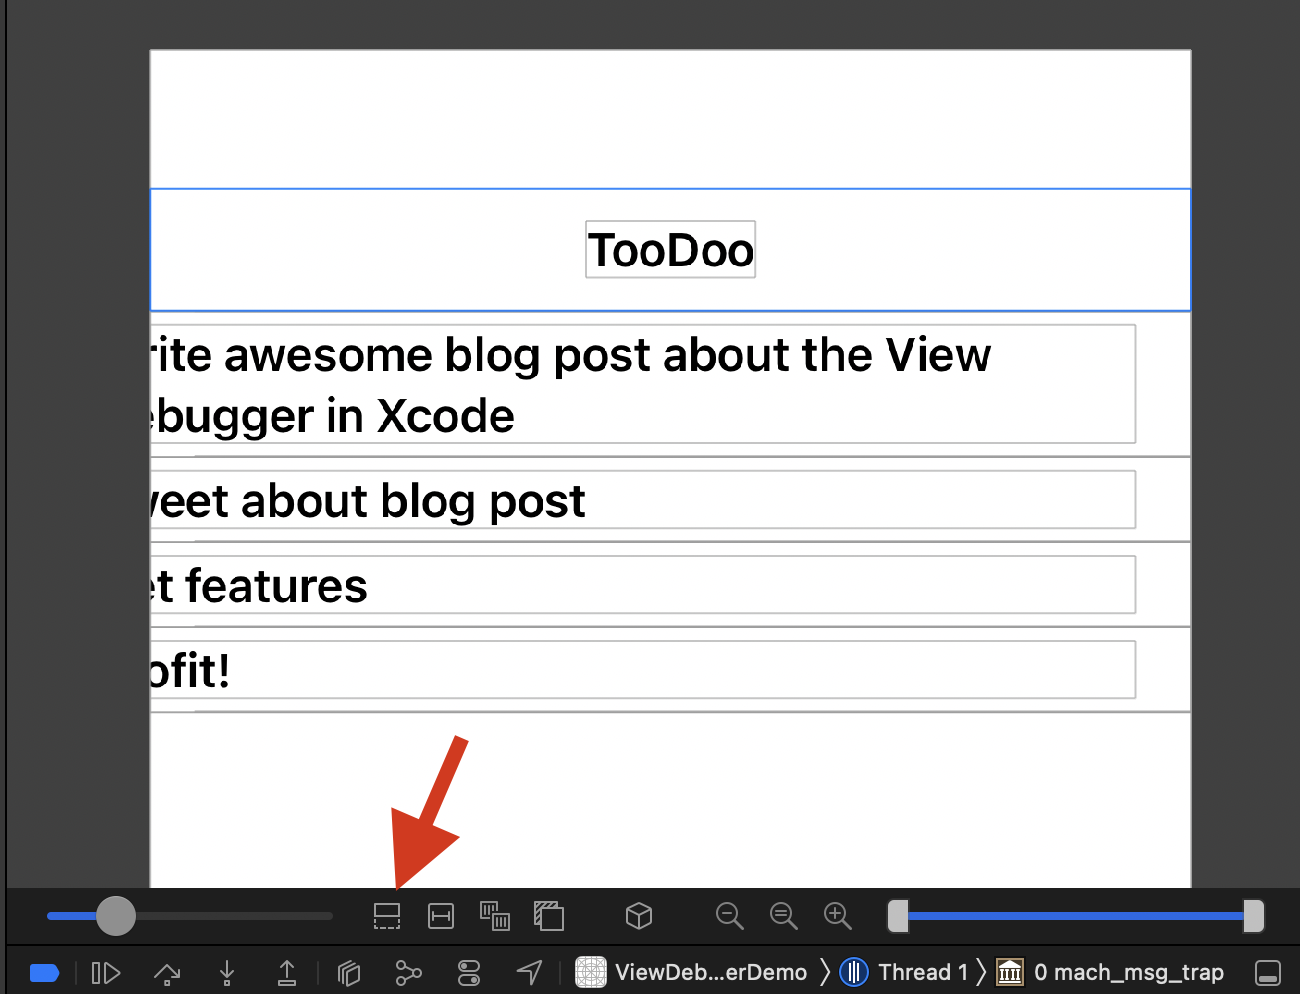
When ever I have a problem in the user inteface of and app or when I just need to confirm that my assumptions about the user interface are correct, I start the View Debugger in Xcode. When the app is running in the Simulator, Xcode shows the debug bar. The icon with the three squares viewed from the side, halts the execution of the app (like a breakpoint does) and opens the View Debugger with the current view.
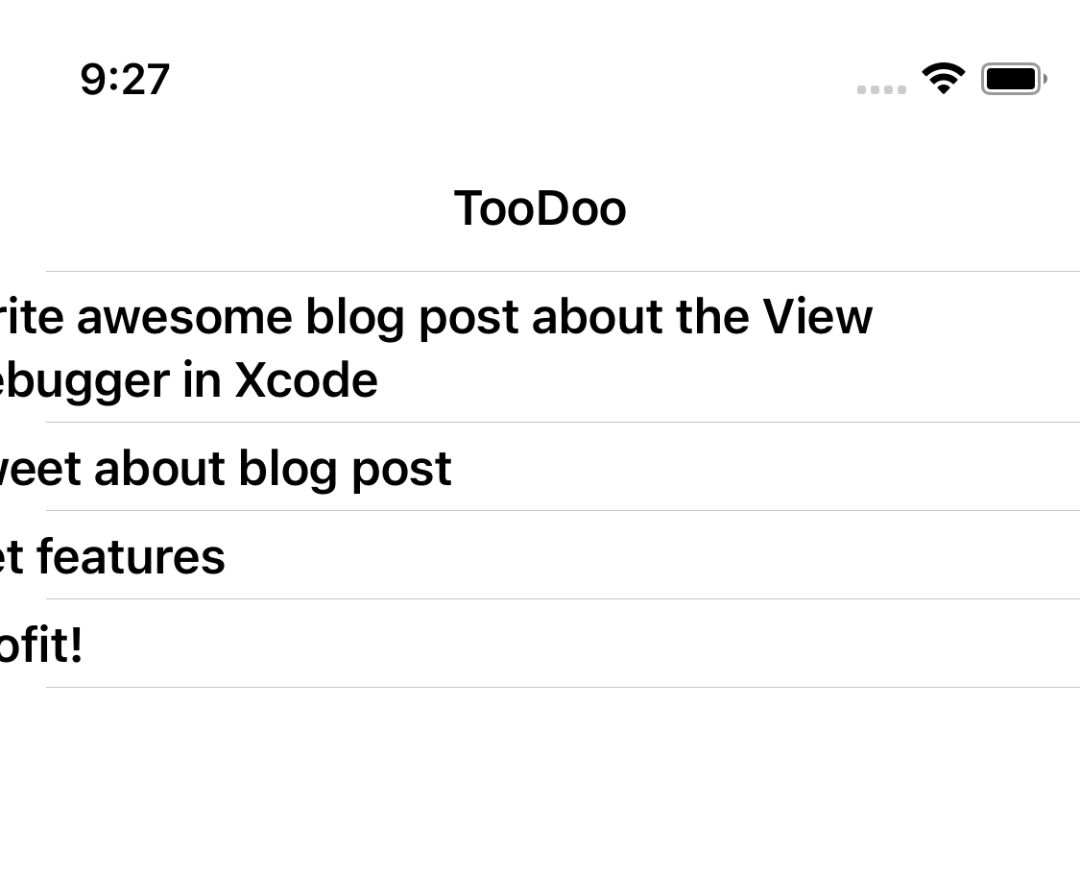
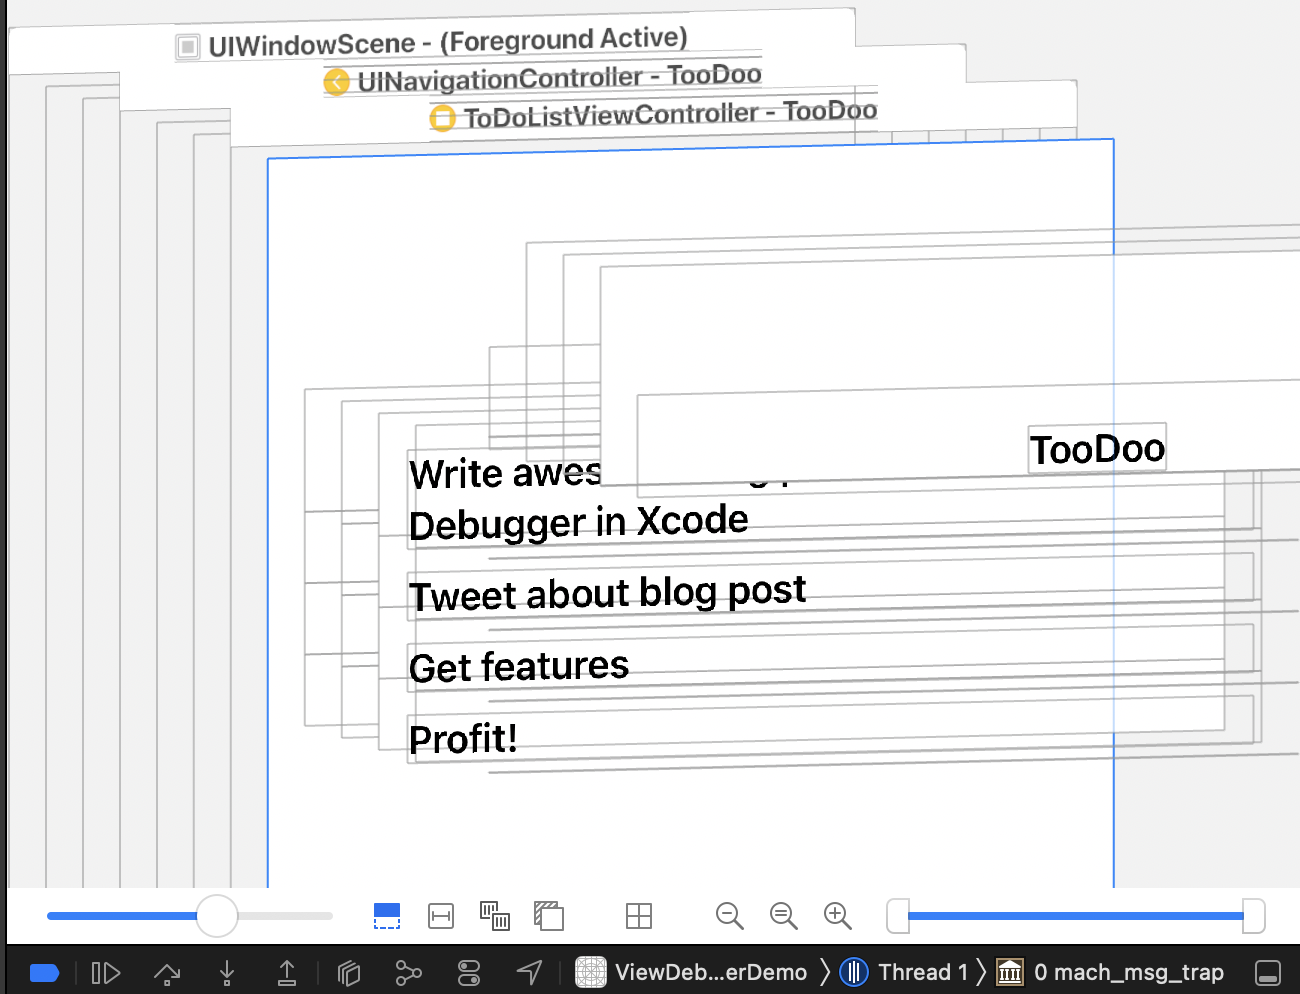
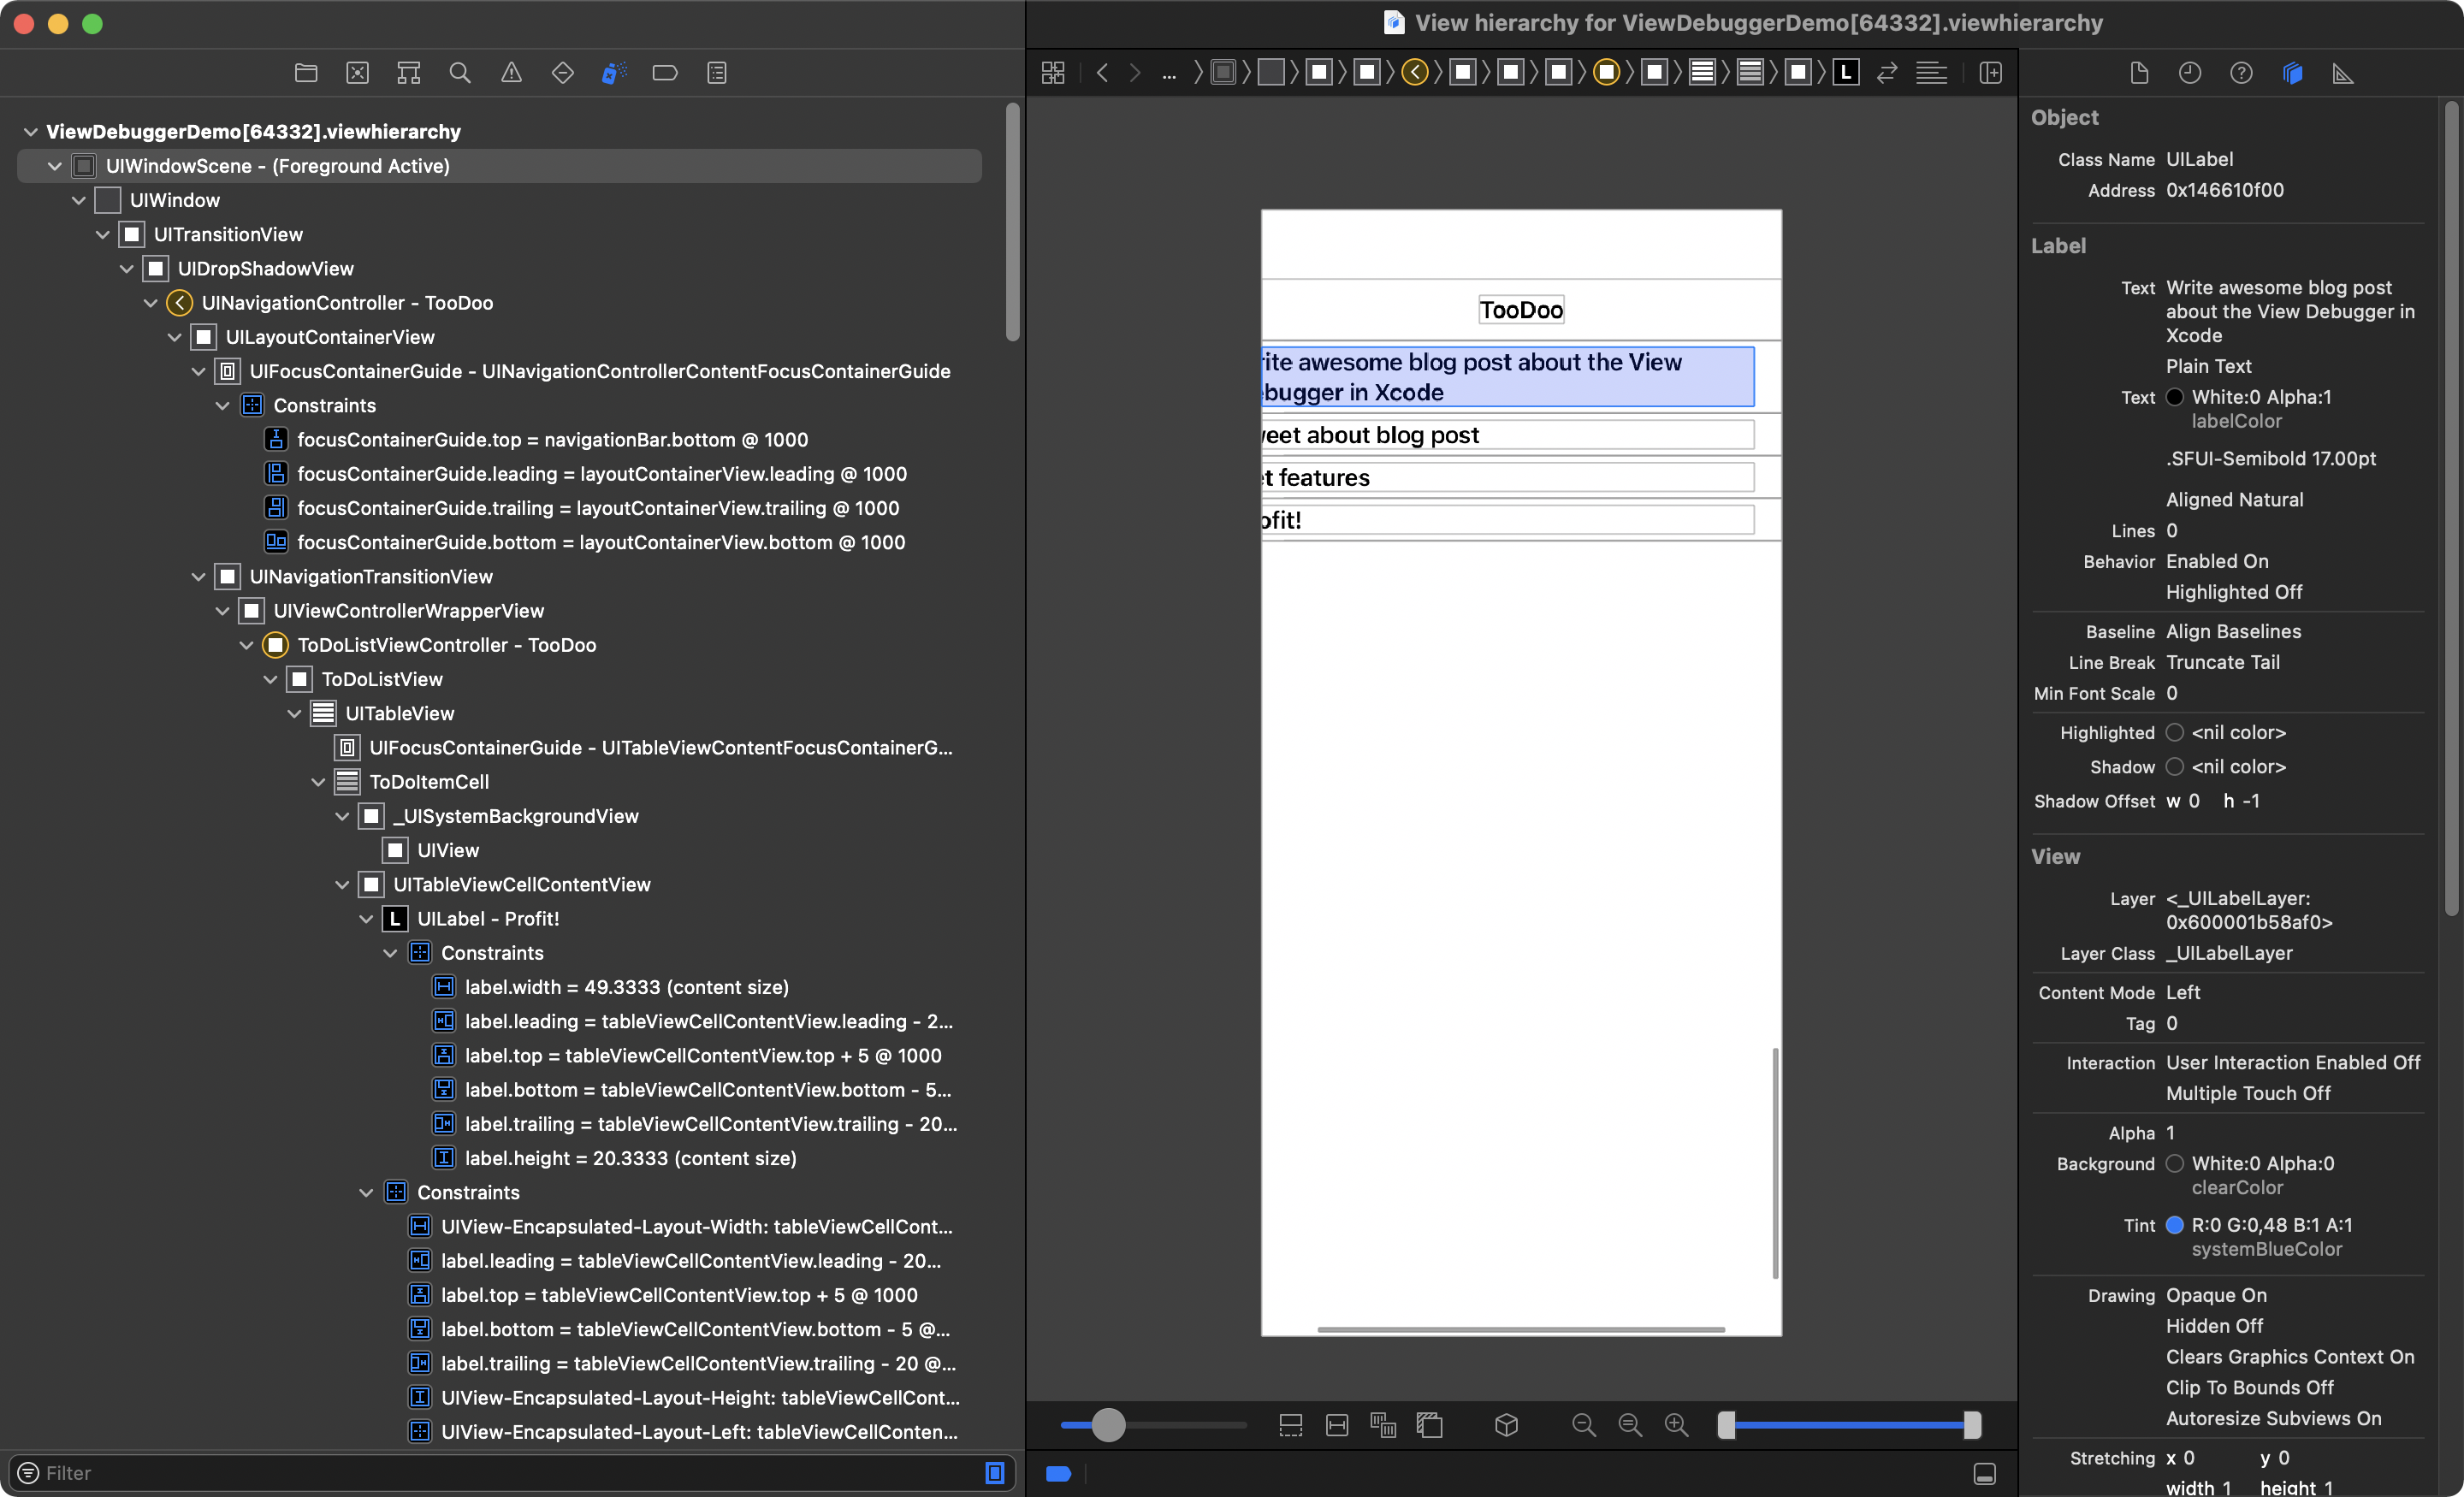
For a simple to-do app, the view debugger looks like this:
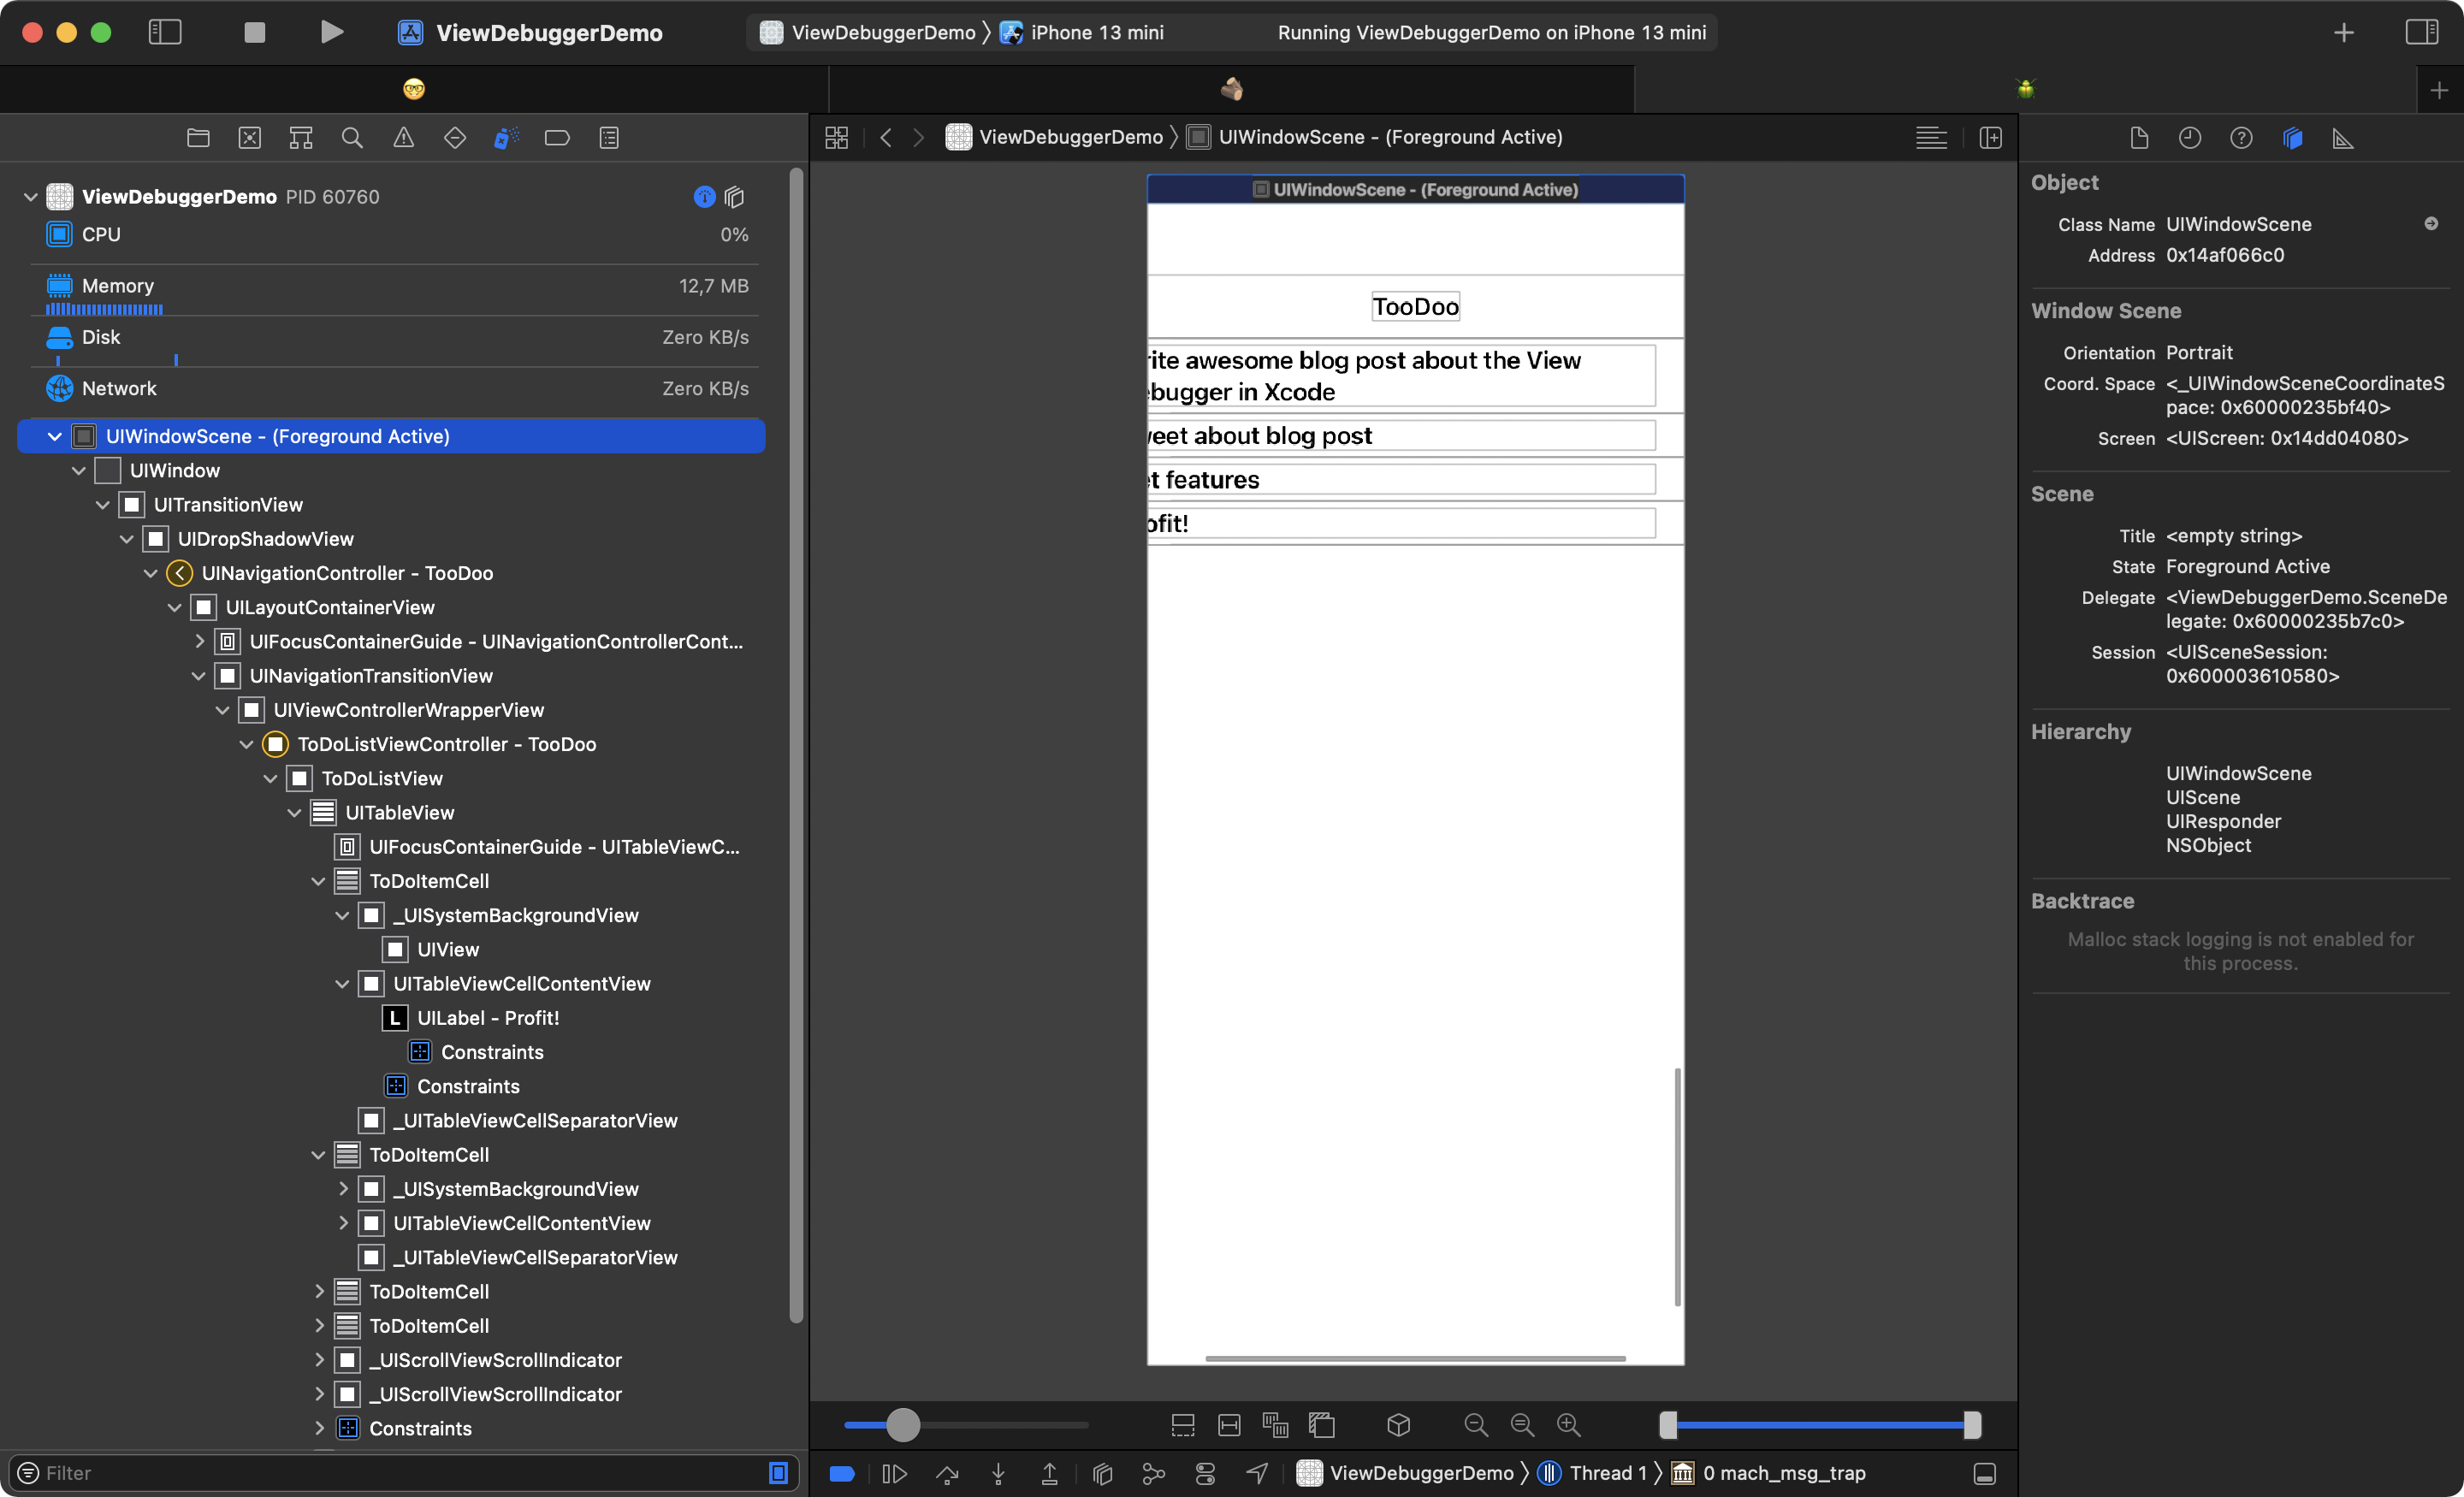
On the left side the View Debugger presents the view hierachy of the currently visible view. It shows all the views you defined but also the views (and view controllers) iOS created for you. See for example the UILayoutContainerView or the _UISystemBackgroundView. This representation of the view hierachy gives you a fantastic overview of what is going on in the visible screen. You can use this presentation to confirm that the user interface elements are added to the expected super views.
Object inspector
When you select a user interface element in the editor in the middle, Xcode shows you the properties and configurations of that element in the inspectors on the right. The object inspector shows the following sections:
Object
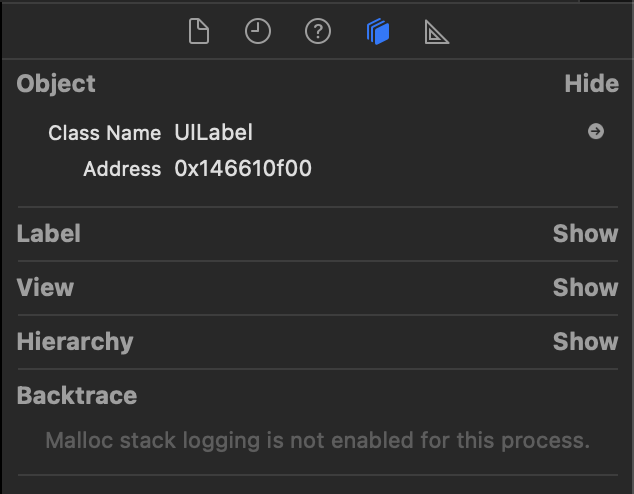
The selected object is an UILabel and you also get its address in memeroy. The address is useful if you want to change its properties or inspect it further using lldb.
Label
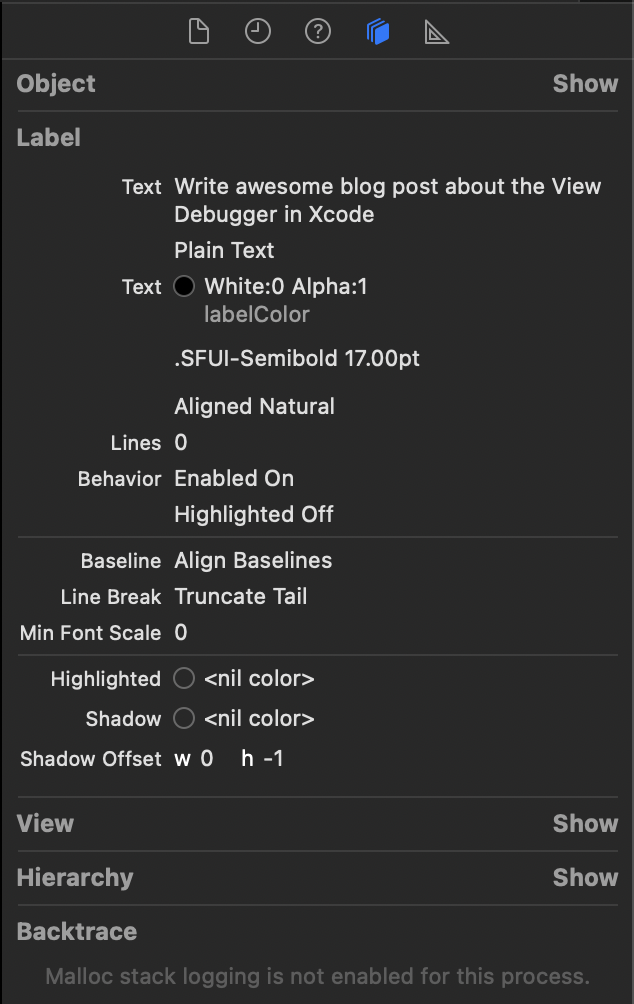
In the Label section Xcode tells you the values of all the properties of a UILabel. For example you see the text an the text color and how many lines the label can show. In this case it is configured to show as many lines as are needed to present the set text (Lines 0).
View
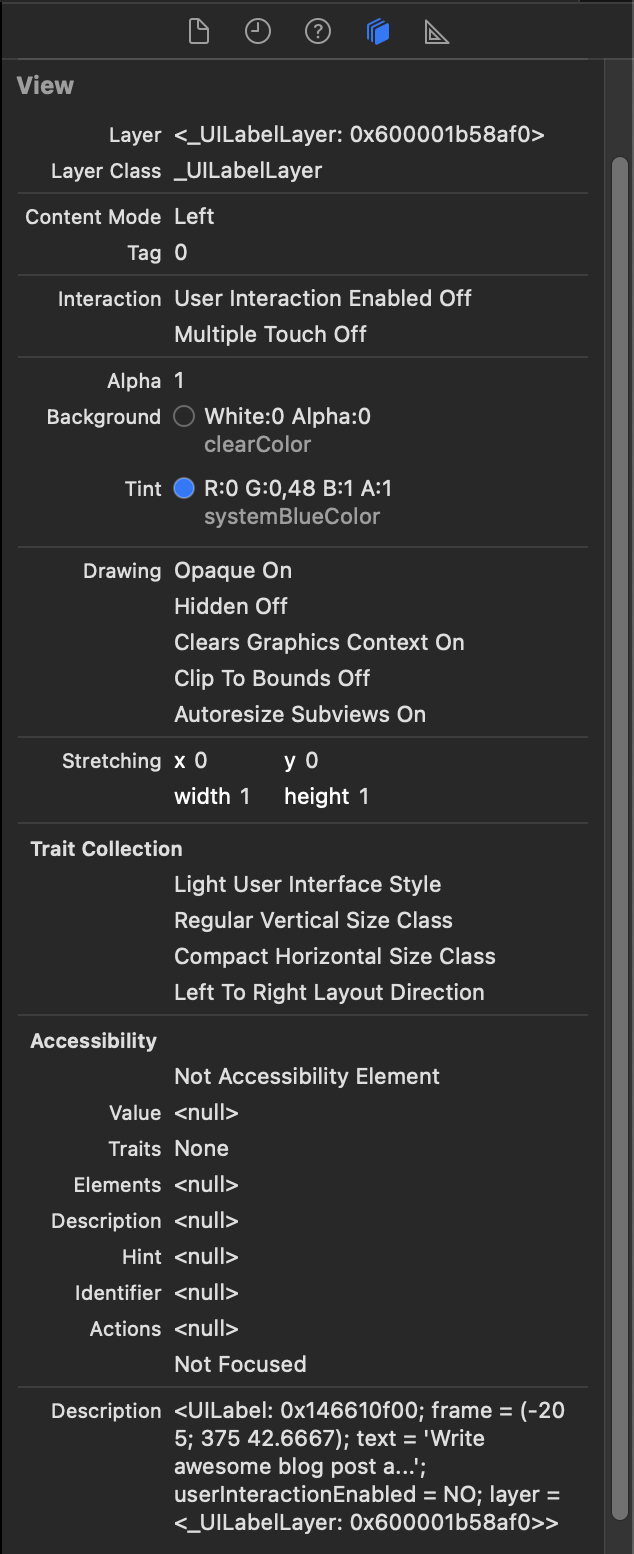
In the View section Xcode tells you all the view properties of the label. For example you can read there if the user interaction is enabled and if the label registers multi-touch.
Note the last sub-section called Description. Shown here is the description string of that UI element. Some information, like added gesture recognizers, are only shown here.
Hierarchy
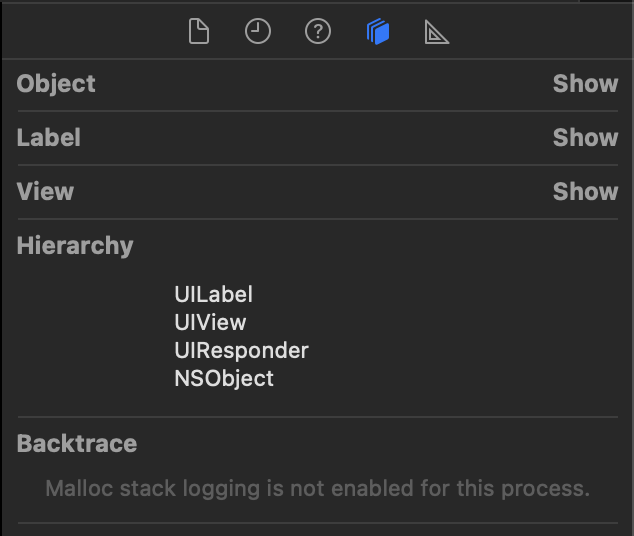
The Hierachy section tells you the inheritence tree of the UI element.
Size Inspector
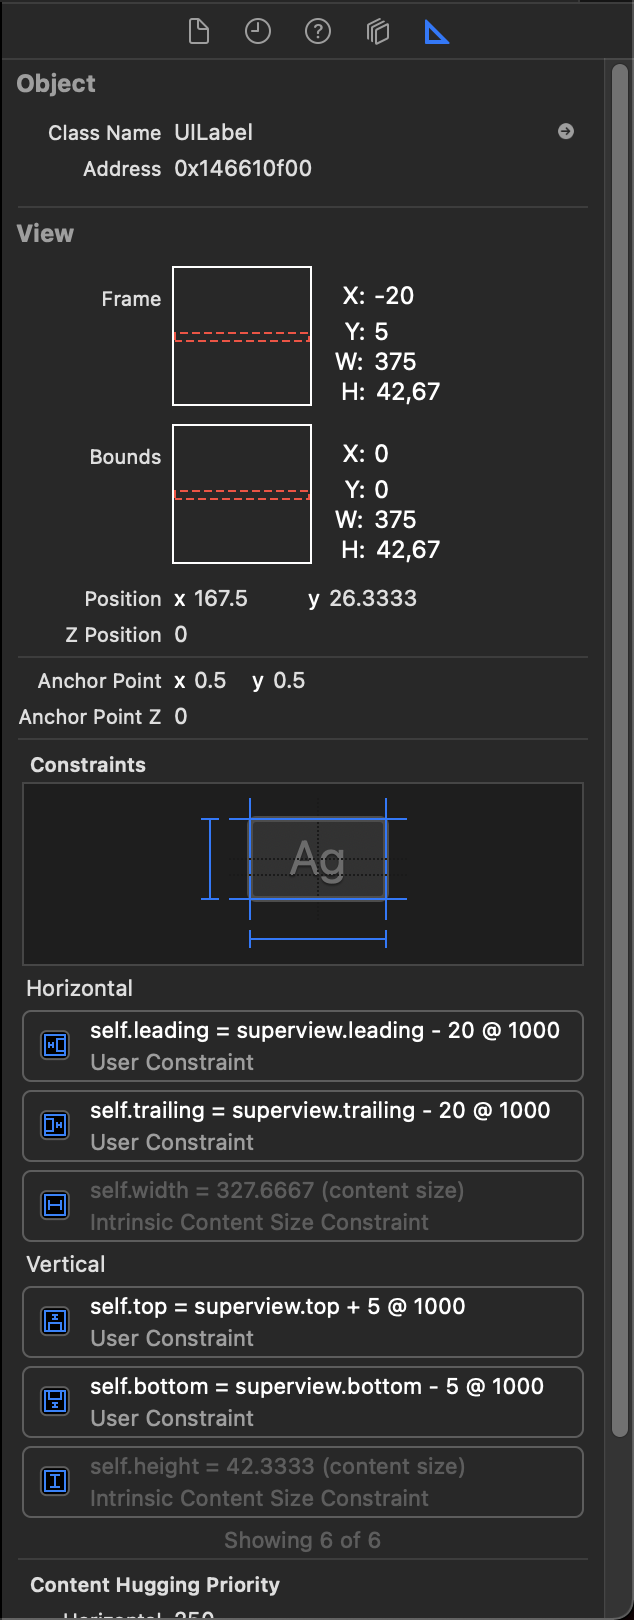
The size inspector shows you the frame and bounds and the contstraints of the selected element. These informations are often my first stop to figure out the root of a layout problem.
Finding a bug
Let’s assume, there is this app, you are working on.
The text is not shown as you planed. It looks like the labels in the table view cells are shifted to the left. As this is your first project without a Storyboard, you are not sure what is going on. Maybe the constraints are wrong.
You start the view debugger. To check if the labels are in fact shifted to the right, you activate Show Clipped Content.
This setting tells the view debugger to render the parts of the views that are clipped by their super views or by the screen frame. The result looks like this:
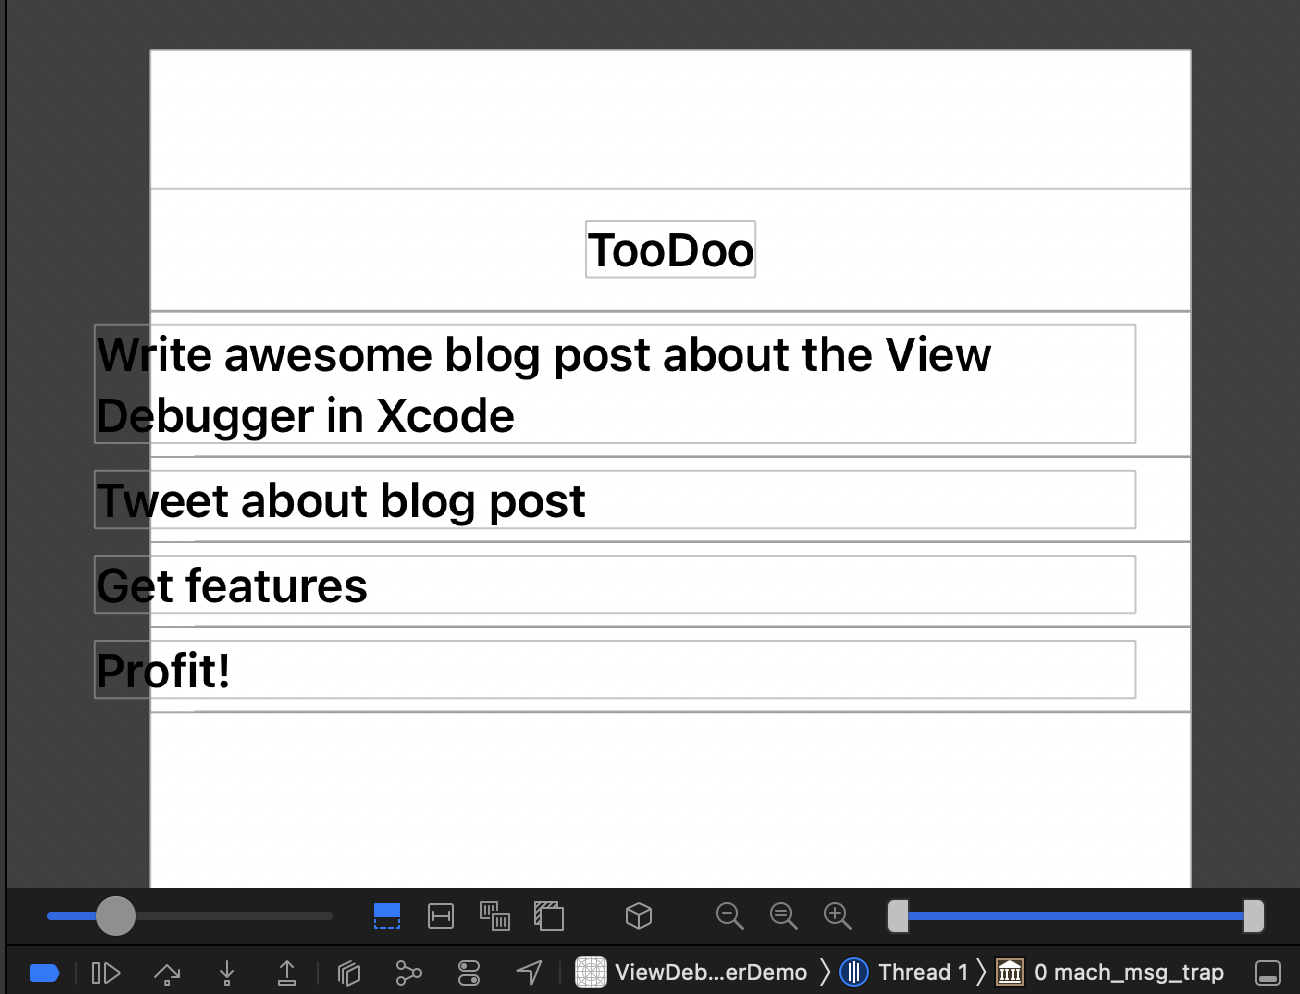
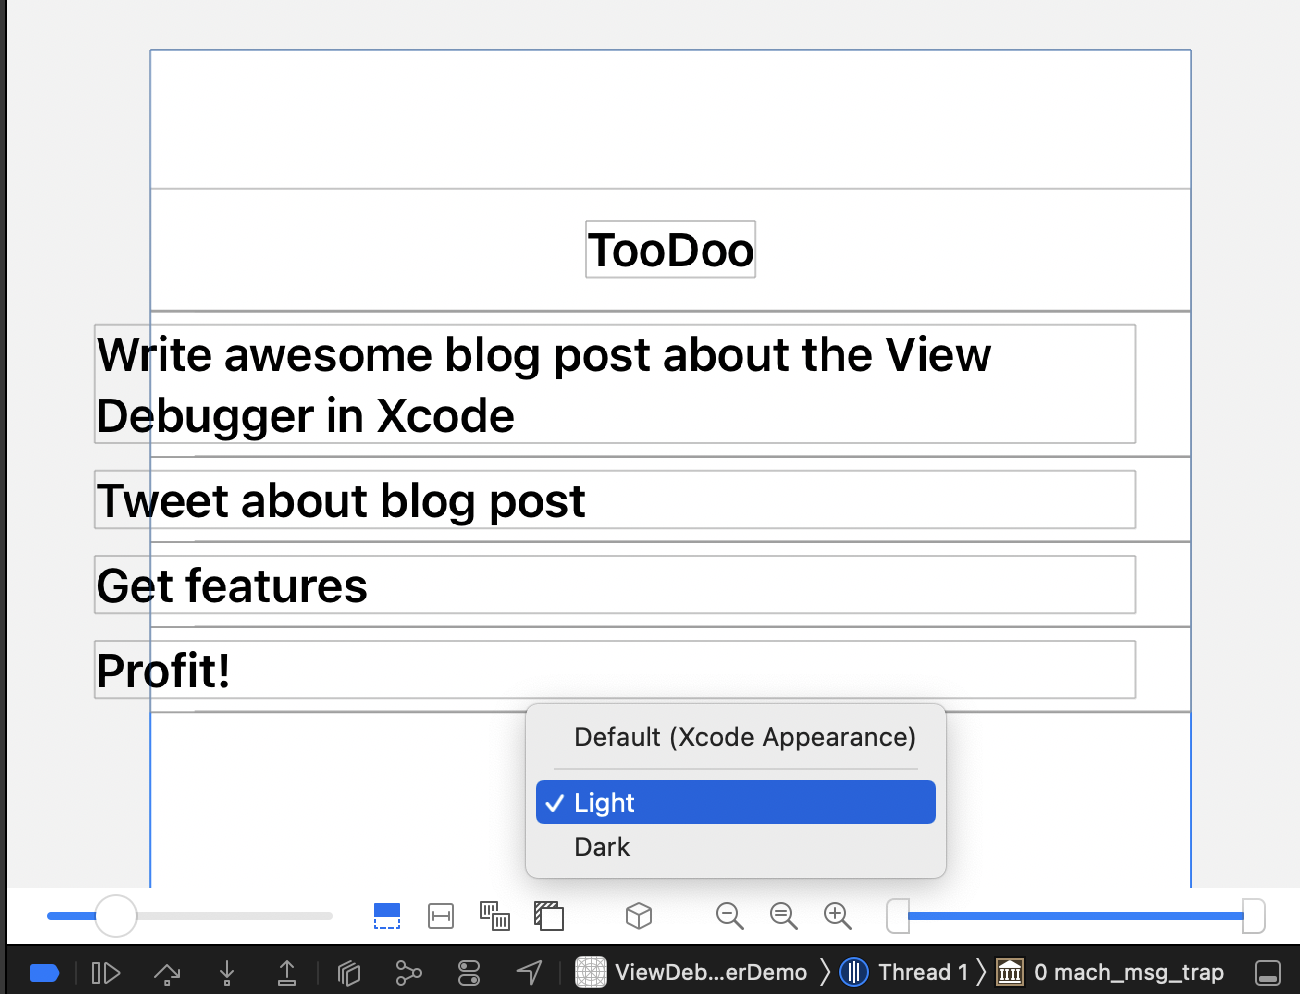
You can see that the label are indeed shifted to the left but it’s hard to see. Fortunately Xcode has you covered. You can Change canvas background color.
Better! But how is the label added to the cell? Is it put directly onto the content view or is it added to a host view? To figure that out, you can Orient to 3D by clicking the button with the cube or by dragging the view with the mouse pointer.
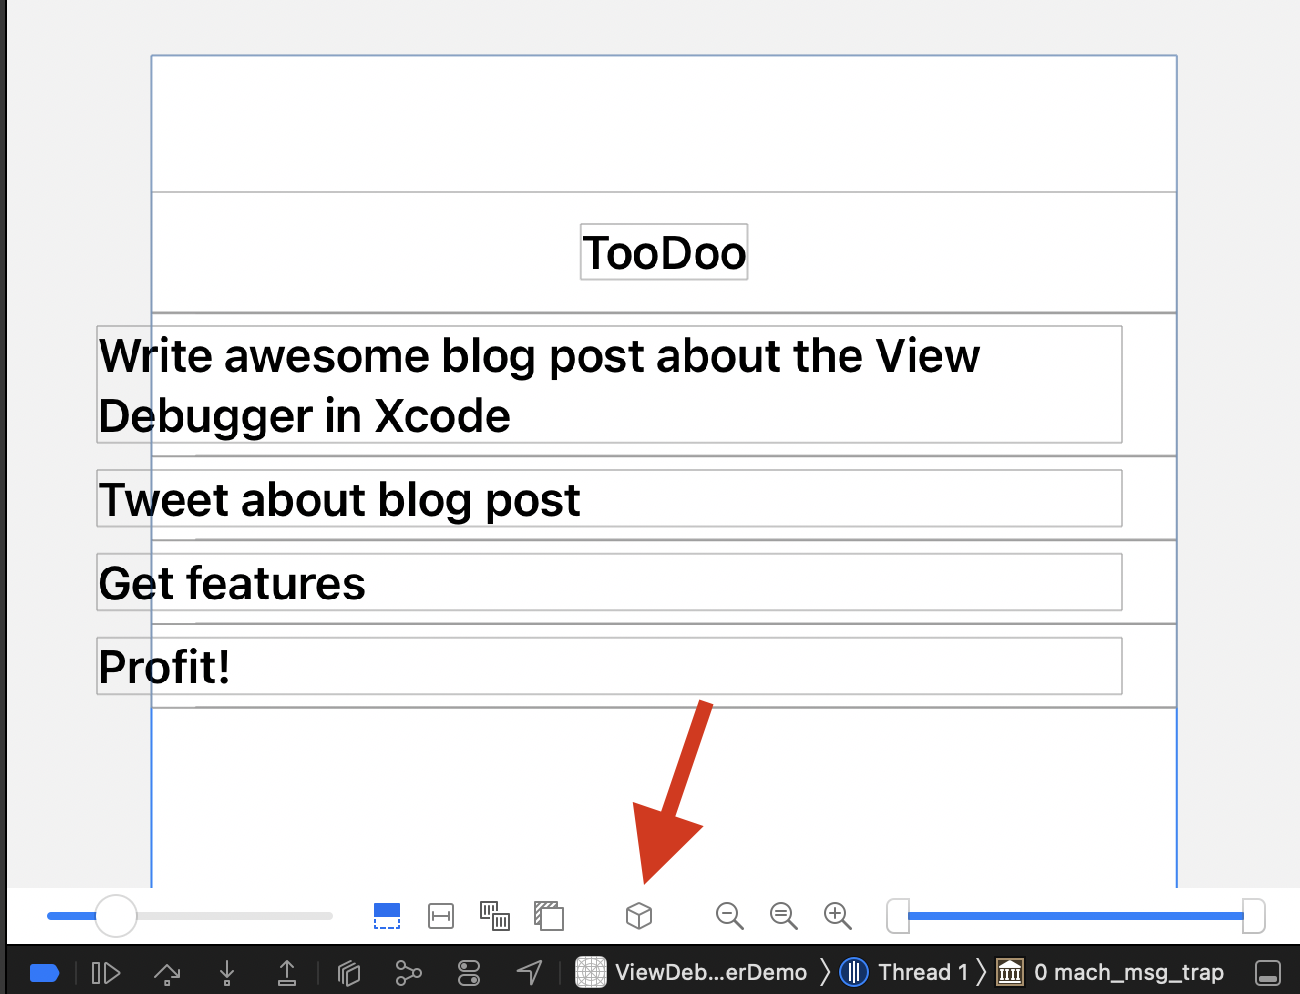
The view debugger then shows you the views from an angle and changes z distance between the views to make the hierarchy clearer. The slider on the left lets you change the z distance further.
Better. But you still can’t clearly see what is going on. You’d like to see the constraints for the seleced view in the view debugger editor. To do that, you select the button Show constraints button.
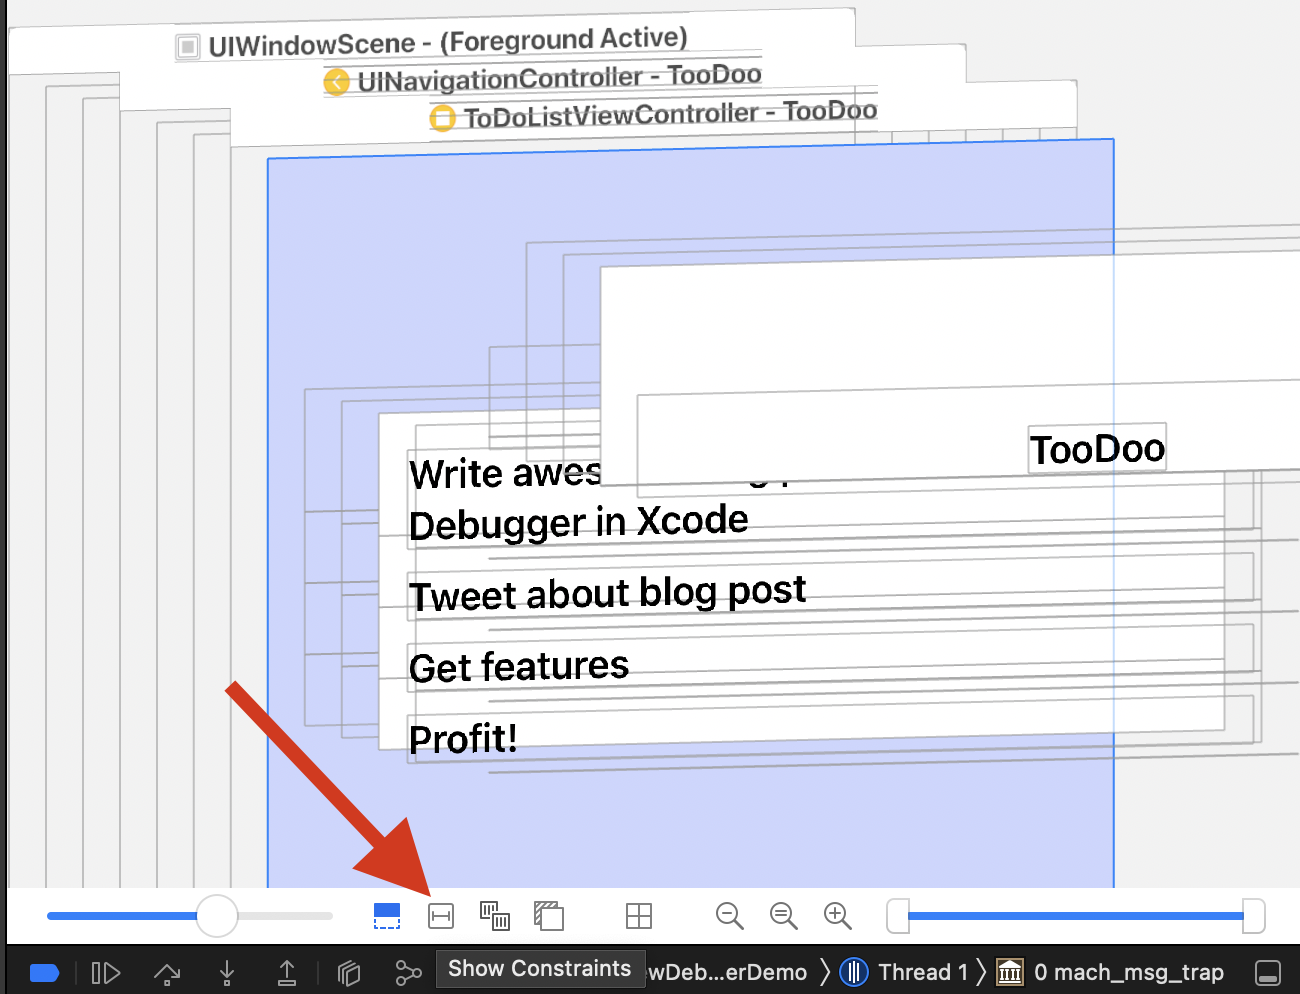
Then you select one of the labels with the problem and inspect the constraints.
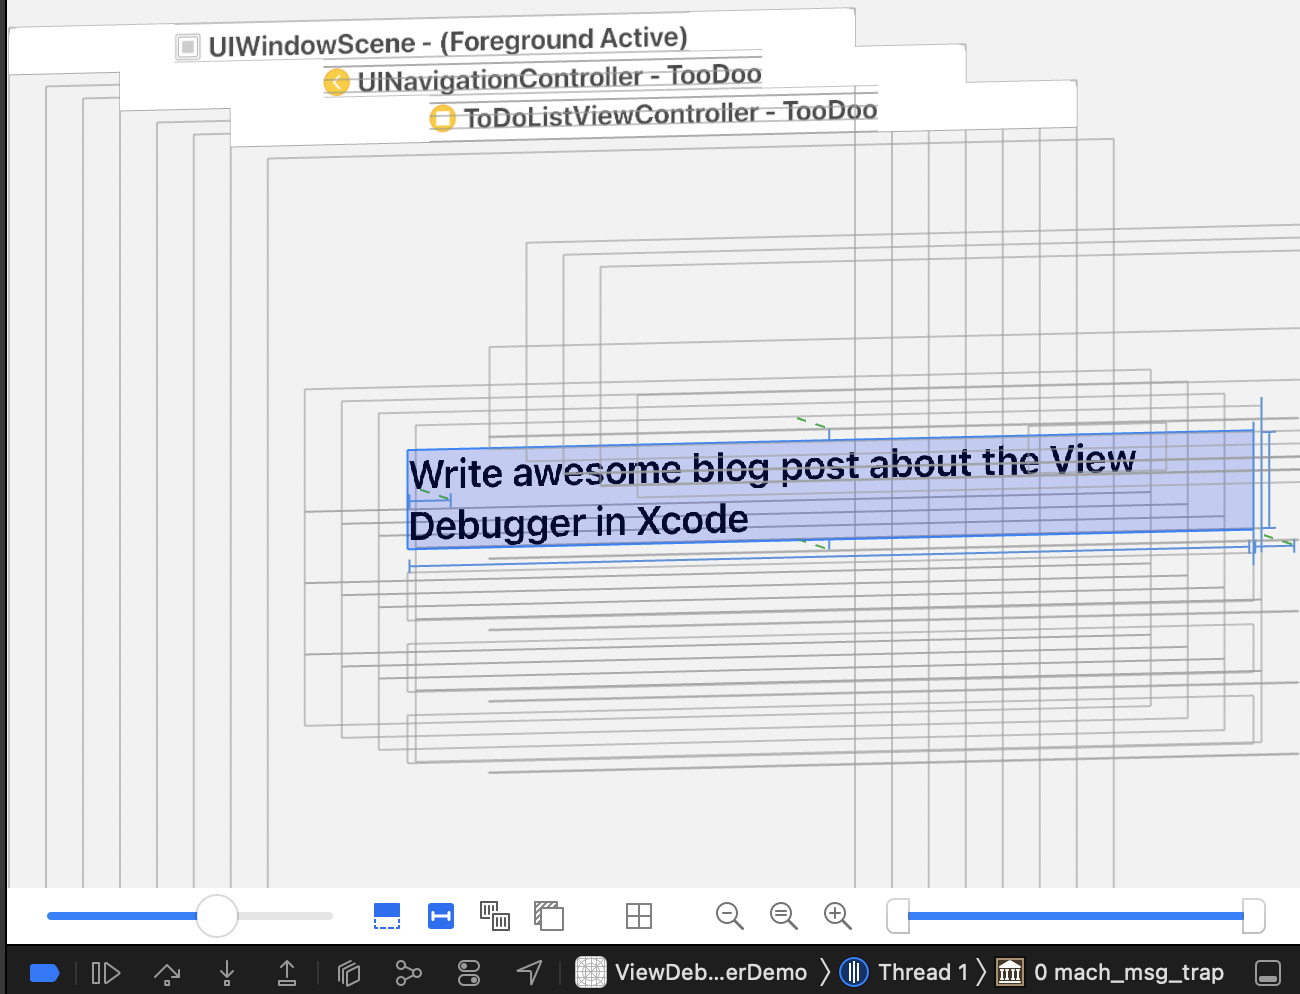
With all the other elements in the way, it’s hard to see what the problem might be. So you narrow down the shown views to the important portion using the range slider on the right. After you have zoomed in and changed the perspective a bit, you can clearly see what is going on with this constraint.
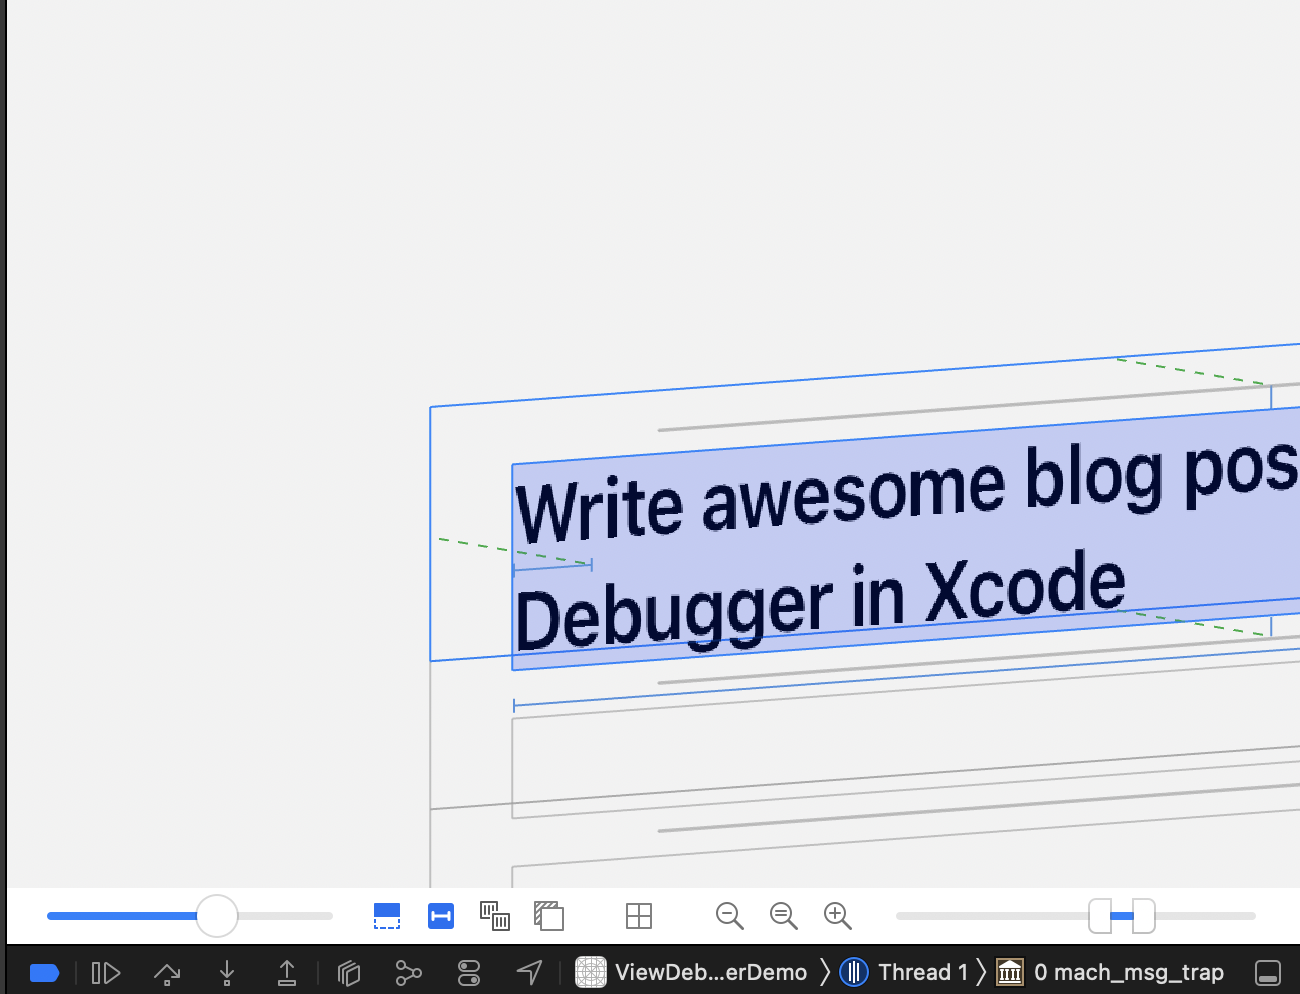
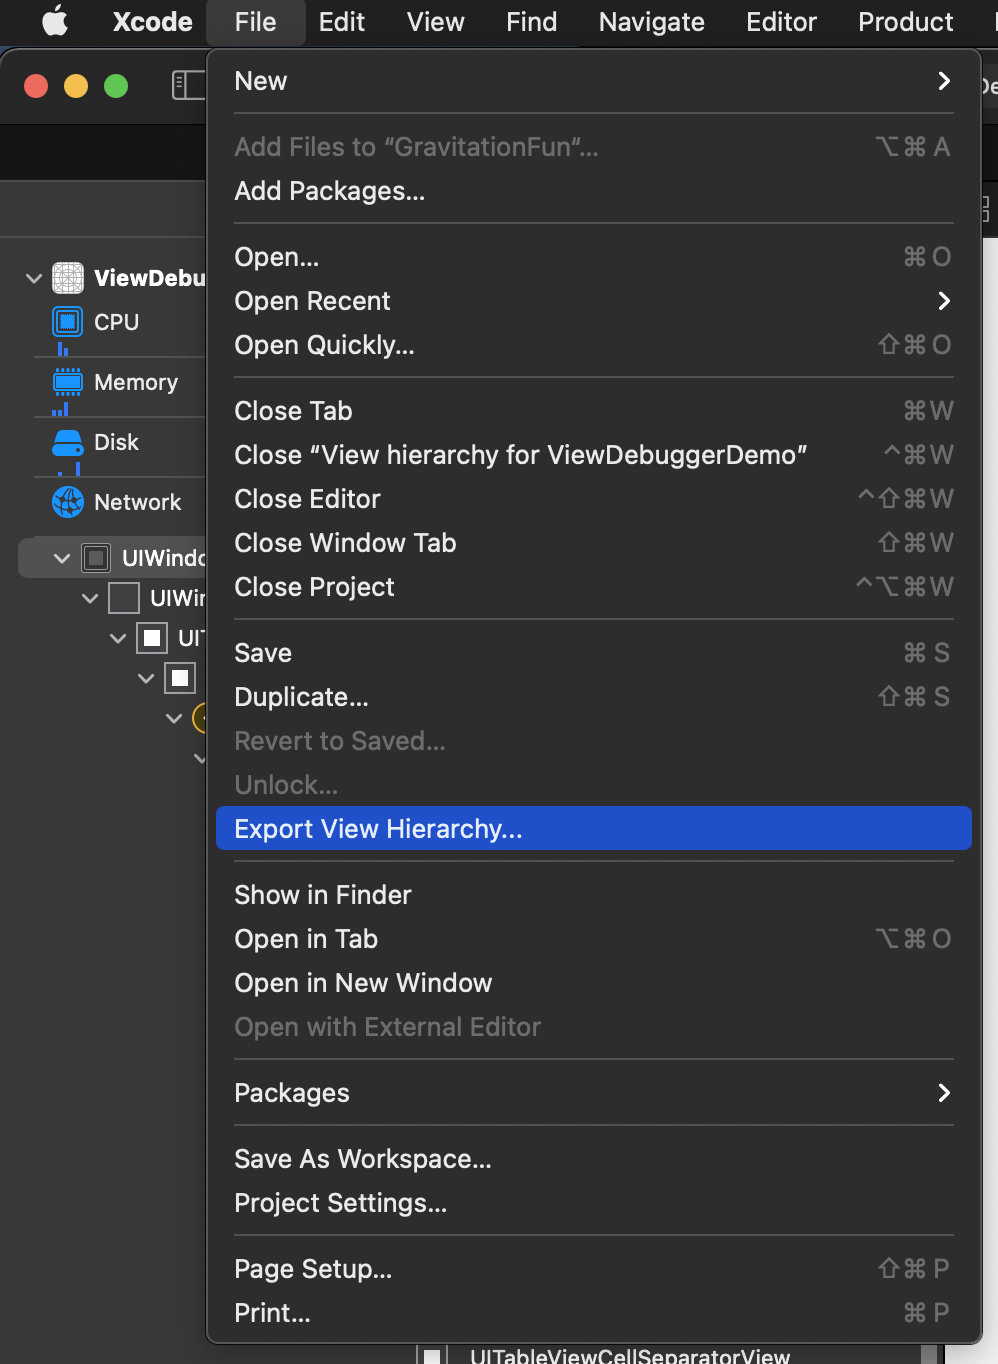
OK, it looks like the constant of the leading constraint of that label is wrong. But you are not that experienced and want to ask your co-worker. So you export the view hierarchy as it is shown in the view debugger with the menu item
You send the resulting file to your co-worker and she can open it on her Mac without even having the project stored on her Mac.
This way, your co-worker can confirm your results and you can finally fix the bug.
Conclusion
The View Debugger is a valuable tool to figure out bugs and problems in the user interfaces of your apps. Even if there is no problem, you can us it to get insight into how the view hierarchy is constructed.
Feedback
Let me know what you think about this feature and this blog post on Twitter: @dasdom.